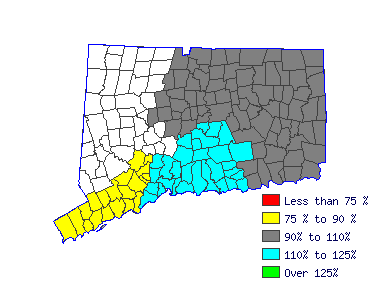
| Develop or apply mathematical or statistical theory and methods to collect, organize, interpret, and summarize numerical data to provide usable information. May specialize in fields such as bio-statistics, agricultural statistics, business statistics, or economic statistics. Includes mathematical and survey statisticians. Excludes Survey Researchers (19-3022). |
 |
| Mean Wage History |
| Year | This
Occupation | Compared to
Occupational Group | Difference |
| Current | $46.73 | | $42.43 |
| $4.30 |
| 2015 | $45.54 | +2.6% | $41.35 |
+2.6% | $4.19 |
| 2014 | $44.69 | +1.9% | $40.58 |
+1.9% | $4.11 |
| 2013 | $43.84 | +1.9% | $39.80 |
+1.9% | $4.03 |
| 2012 | $42.98 | +2.0% | $39.03 |
+2.0% | $3.96 |
| 2011 | $42.32 | +1.6% | $38.42 |
+1.6% | $3.89 |
| 2010 | $41.57 | +1.8% | $37.75 |
+1.8% | $3.83 |
| 2009 | $41.13 | +1.1% | $37.35 |
+1.1% | $3.78 |
| 2008 | $39.91 | +3.1% | $36.23 |
+3.1% | $3.67 |
| 2007 | $38.57 | +3.5% | $35.02 |
+3.5% | $3.55 |
| Year | This
Occupation | Compared to
All Occupations | Difference |
| Current | $46.73 | | $21.85 |
| $24.88 |
| 2015 | $45.54 | +2.6% | $21.24 |
+2.9% | $24.30 |
| 2014 | $44.69 | +1.9% | $20.78 |
+2.2% | $23.91 |
| 2013 | $43.84 | +1.9% | $20.37 |
+2.1% | $23.47 |
| 2012 | $42.98 | +2.0% | $20.02 |
+1.7% | $22.97 |
| 2011 | $42.32 | +1.6% | $19.70 |
+1.6% | $22.61 |
| 2010 | $41.57 | +1.8% | $19.37 |
+1.7% | $22.21 |
| 2009 | $41.13 | +1.1% | $19.11 |
+1.4% | $22.02 |
| 2008 | $39.91 | +3.1% | $18.62 |
+2.6% | $21.29 |
| 2007 | $38.57 | +3.5% | $18.02 |
+3.3% | $20.55 |
 |
|
| Reference Date: 1st Quarter 2016 |


